Series: Customer Retention Playbooks
Who it’s for: Revenue leaders & Customer Success managers
Outcome: Reduce churn by 27–40% and boost LTV
Time to value: 90 days
Start here: The fastest path to profit is keeping the clients you already have → Customer Retention & Churn (AI) hub
In This Playbook (Table of Contents)
- The Churn Problem: Why Reactionary Service Fails
- Why AI Churn Prediction Changes Everything
- Step 1: Deploy Predictive Churn Scoring
- Step 2: Automate Hyper-Personalized Intervention
- Step 3: Build the Loyalty Amplification Loop
- Expected Results: The Business Impact
- Implementation Checklist: Your First 30 Days
- Frequently Asked Questions
- Related Playbooks
The Churn Problem: Why Reactionary Service Fails
Acquiring a new customer costs 5–25× more than retaining one, yet most teams operate reactively. By the time you wait for complaints or usage drops, you’re already losing:
- Silent majority: Up to 60% of churners never submit a ticket or feedback.
- Forecast stability: Elevated churn wrecks revenue predictability and valuation.
AI alternative: Identify at-risk customers 30–90 days before they mentally check out—when intervention still works.
Why AI Churn Prediction Changes Everything
AI turns firefighting into proactive relationship management by detecting leading indicators humans miss.
What AI detects that humans miss
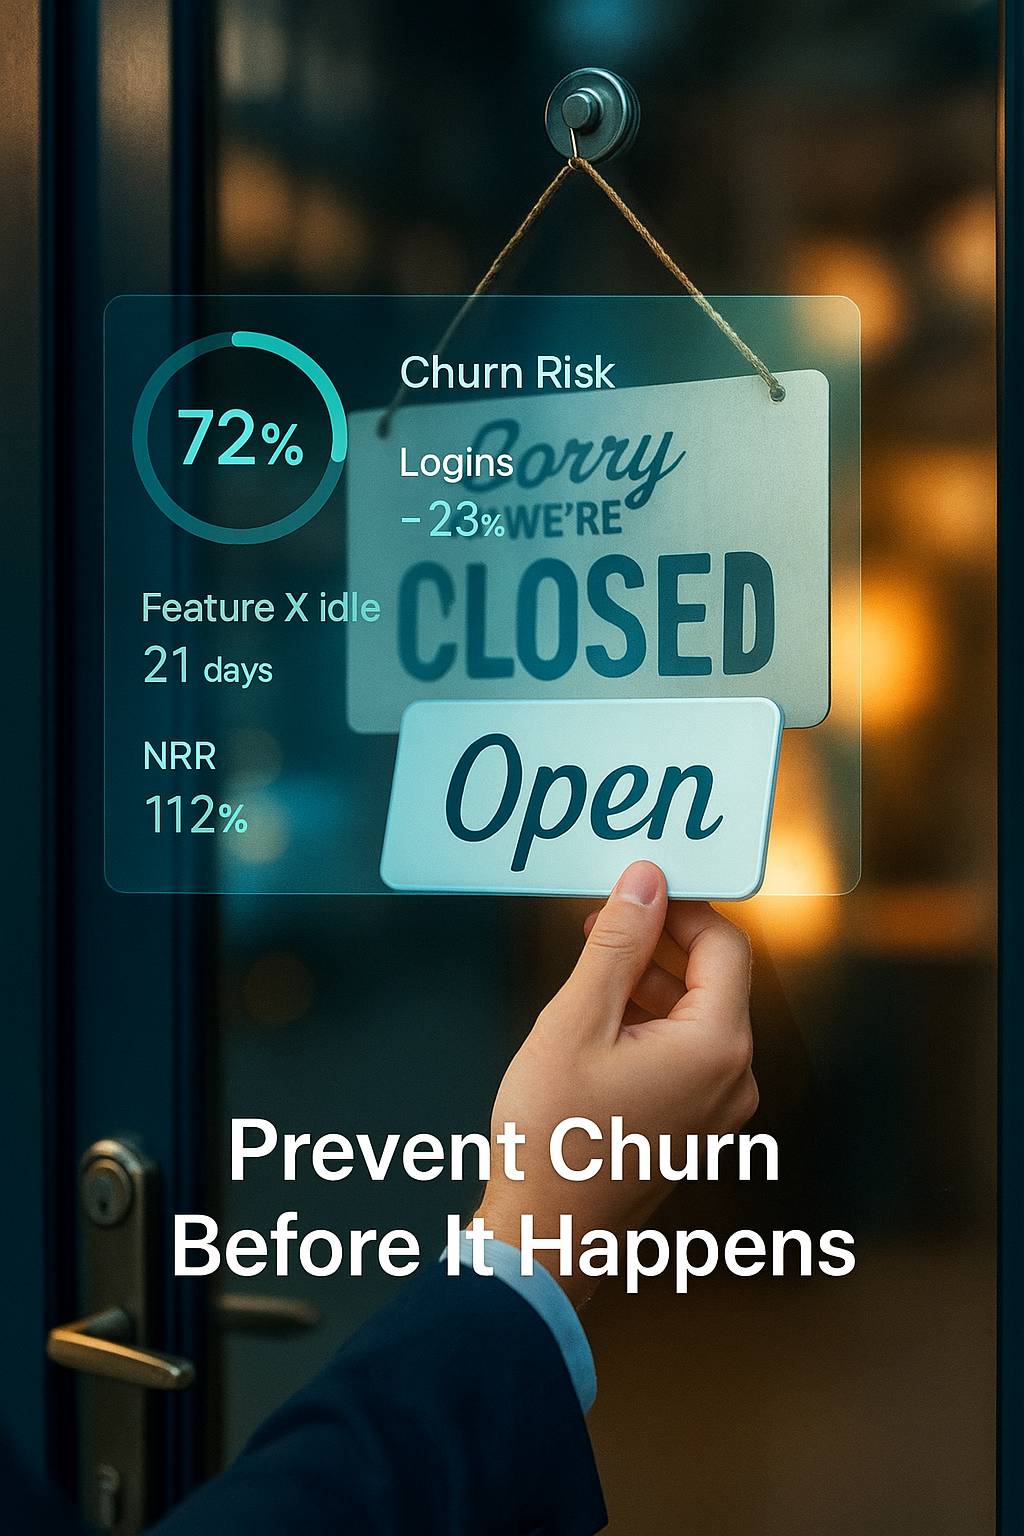
- Usage pattern shifts: e.g., 23% login decline over 14 days
- Feature abandonment: key features unused for 2+ weeks
- Support sentiment: frustrated tone despite “resolved” status
- Champion turnover: your internal advocate changes roles
- Renewal timing: budget freezes 60+ days pre-renewal
The predictive advantage (typical)
| Approach | Success Rate | Timing |
|---|---|---|
| Last-minute “save” | 15–25% | Week before renewal |
| AI early-warning intervention | 65–85% | 1–3 months pre-churn |
Early, targeted outreach is 3–4× more effective because customers are still invested in outcomes.
Step 1: Deploy Predictive Churn Scoring
Build a health engine that evaluates every account daily (0–100) using:
- CRM: contracts, renewals, comms history
- Product analytics: feature usage, sessions, completion rates
- Support: ticket volume, time to resolution, sentiment
- Billing: payments, plan changes, invoice status
Risk tiers
- 60–79 At-Risk → proactive engagement
- 40–59 Critical → immediate CSM assignment
Daily manager workflow
- Sort by risk; investigate 7-day score jumps >20.
- Assign targeted actions for scores ≥60.
- Track which actions reduce risk within 30 days.
Step 2: Automate Hyper-Personalized Intervention
Speed and relevance win; automation ensures no at-risk account slips.
Triggered workflow (example: score <70)
- Day 0: AI pinpoints causes; send a personalized email referencing exact behaviors (e.g., feature X unused since date) and link the exact resource (video, template). Internal alert to assigned CSM with a risk brief.
- Day 3: In-app message on next login with 1-click scheduling and contextual help.
- Day 7: Auto-create CSM task with a brief (usage trends, last tickets, gaps, talk tracks). Offer training/integration help or targeted preview.
- Day 14: If still <50, escalate to manager; exec outreach for high-value accounts; consider a calibrated retention offer.
Result: Hyper-personalized messages routinely lift responses from ~3–8% to 25–45%.
Step 3: Build the Loyalty Amplification Loop
Don’t just save accounts—amplify champions.
Identify champions (inverse signals)
High usage vs. cohort, low support friction, fast adoption of new features, reliable payments, consistent engagement.
Automated champion playbook (score >85 for 60+ days)
- Testimonial or case study: “You achieved X% in Y—can we write it for you?” Incentivize with beta access or SLA perks.
- Referral invite: Personalized ask + unique referral link.
- Expansion motion: Data-driven upsell tied to observed constraints.
- Community leadership: Advisory board, beta cohort, speaking slot.
Expected Results: The Business Impact
| Metric | Typical Impact | Business Benefit |
|---|---|---|
| Churn rate | −27–40% | Fewer cancellations |
| Customer Lifetime Value (LTV) | +35–50% | Longer tenure, more expansion |
| Net Revenue Retention (NRR) | 105–120% | Expansion offsets churn |
| CSM productivity | 3–4× accounts | 30–50 → 100–150 with triage automation |
Implementation Checklist: Your First 30 Days
Week 1 — Foundation
- [ ] Audit CRM, product analytics, support, billing
- [ ] Pick a customer success platform (CSP) by budget/scale
- [ ] Define initial health parameters from churn history
Week 2 — Integration
- [ ] Connect sources; configure baseline scoring
- [ ] Back-test vs. churned/retained cohorts
- [ ] Train CS team on dashboards and actions
Week 3 — Automation design
- [ ] Map journey; define intervention points
- [ ] Build 3 workflows: at-risk alert, engagement trigger, champion ID
- [ ] Create personalized email/message templates
Week 4 — Launch & monitor
- [ ] Pilot on 10–20% of accounts
- [ ] Track responses, score changes, time-to-intervention
- [ ] Tune thresholds and copy based on results
Frequently Asked Questions
How accurate is AI churn prediction?
With the right inputs, teams commonly reach 70–85% accuracy 30+ days ahead, improving as models retrain on your data.
Do we need a data science team?
No—modern CSPs ship prebuilt models. You connect sources and set thresholds.
Will automation feel spammy?
Not if messages reference behavior and offer help. Aim for value-first interactions and monitor unsubscribes (<2% is healthy).
When do we see results?
Expect measurable churn reduction in ~90 days; compounding gains by 6 months.
Related Playbooks
Explore next:
AI Lead Generation · Reduce Costs with AI


